
On our last day in Tanzania, we spent a couple of hours in the Tarangire National Park after breakfast. Here’s the map for that. Here are the animals we saw: Elephants Buffaloes Ostriches Zebras Impalas Wildebeests Dik-diks Afterwards, we headed to Kilimanjaro International Airport for our flight back. On the plane, I took the photo… Continue reading Tanzania Day 11: Tarangire to End
Tanzania Day 10: Tarangire
We spent June 25 in Tarangire National Park. Here’s the tracklog for our morning game drive. We returned to Tarangire Safari Lodge for lunch and spent some time viewing elephants at the river down below. Then we headed out for an afternoon safari drive. Here’s the map. Here are the animals we saw: Baboons Elephants… Continue reading Tanzania Day 10: Tarangire
Tanzania Day 9: Tarangire
On June 24, we stayed in Tarangire National Park. Here’s the map for our day game drive. Here are the animals we saw during the day: Elephants Buffalo Ostriches Zebras Vervet Monkeys Impalas Pelicans Wildebeests Giraffes Warthogs Thomson’s Gazelles Lions Leopard Waterbucks Monitor Lizard Dik-diks Long-crested Eagles Martial Eagles Starlings Python Of course, there were… Continue reading Tanzania Day 9: Tarangire
Tanzania Day 8: Ngorongoro to Tarangire
On June 23, we spent half the day in Ngorongoro Crater and then headed to Tarangire National Park. Here’s the map of our day: Here are the animals we saw: Baboons Elephants Buffalo Ostriches Zebras Wildebeests Crowned Cranes Warthogs Hippopotamuses Thomson’s Gazelles Grant’s Gazelles Hyenas Lions Kori Bustard Guineafowl Waterbucks Black-backed Jackals Hadada Ibis Bat-eared… Continue reading Tanzania Day 8: Ngorongoro to Tarangire
Tanzania Day 7: Serengeti to Ngorongoro
On June 22, we spent the morning in central Serengeti and then headed out. We stopped at the Oldupai Gorge Museum on our way to Ngorongoro Sopa Lodge. Here’s the tracklog for our drive. Here are the animals we saw: Baboons Elephants Ostriches Zebras Lions Vervet Monkeys Wildebeests Giraffes Warthogs Hippopotamuses Thomson’s Gazelles Grant’s Gazelles… Continue reading Tanzania Day 7: Serengeti to Ngorongoro
Tanzania Day 6: Central Serengeti
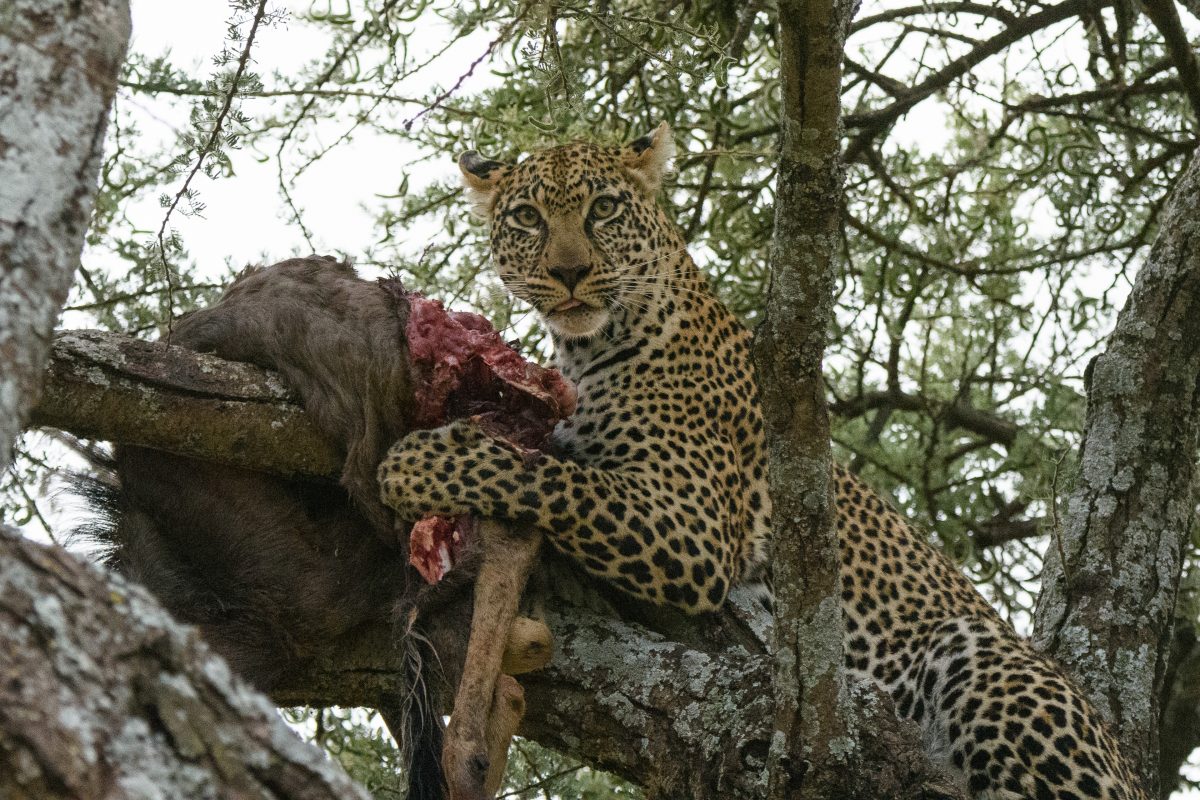
On this day, we set out early from Kati Kati for a game drive. Here’s the track for our morning game drive. After lunch at the camp, we went back out again. Here’s the track for that. This is when we saw the leopard with a wildebeest in a tree. Here are the animals we… Continue reading Tanzania Day 6: Central Serengeti
Tanzania Day 5: Western to Central Serengeti
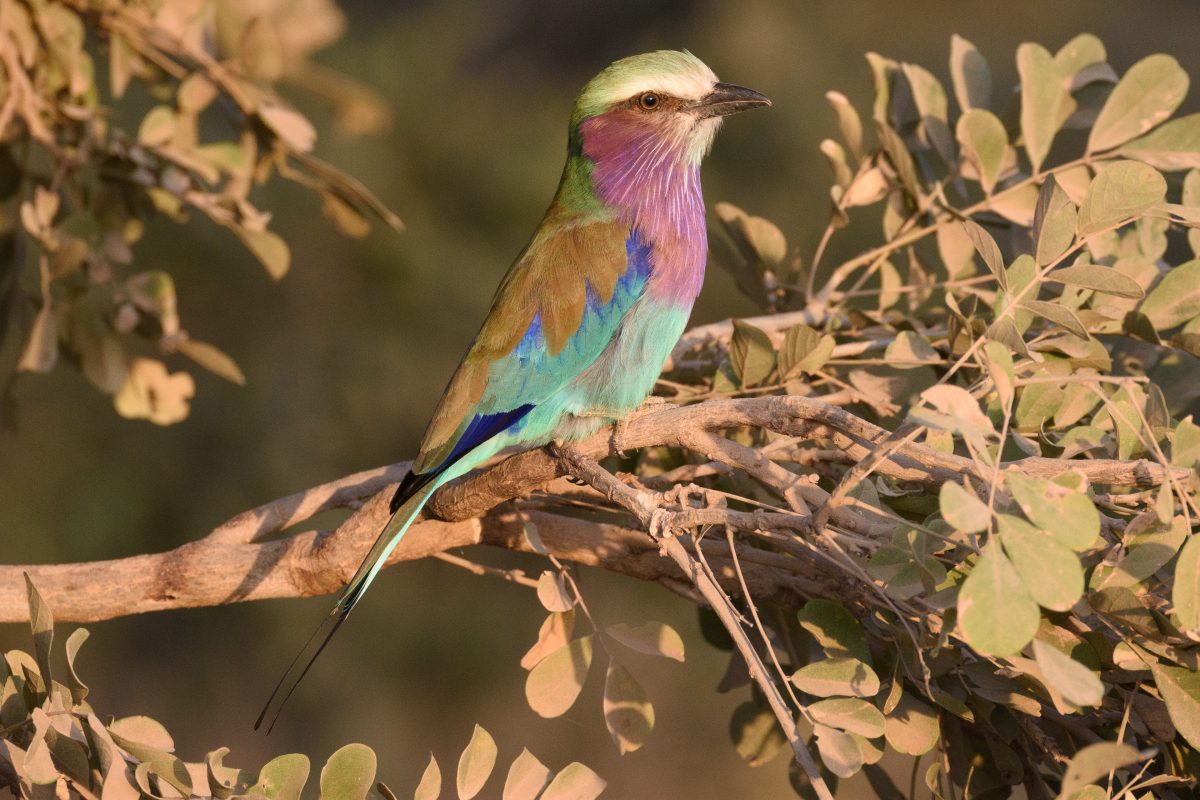
On day 5, we headed back from western Serengeti to central Serengeti. Here’s the map for our game drive. Here are the animals we saw: baboons elephants buffaloes ostriches zebras impalas wildebeests giraffes warthogs herons vultures marabou storks yellow-billed storks topis monitor lizard bateleur mongoose goshawk lilac-breasted rollerbird ground hornbills turtles dik-dik lions hippopotamuses Egyptian… Continue reading Tanzania Day 5: Western to Central Serengeti
Tanzania Day 4: Western Serengeti
On day 4, we explored the western part of Serengeti National Park. Here is the tracklog for our morning game drive. After lunch at the Mbalageti Lodge with beautiful views, we headed back out. Here are the animals we saw (new ones in bold): Baboons ostriches zebras vervet monkeys impalas wildebeests warthogs herons hippopotamuses lions… Continue reading Tanzania Day 4: Western Serengeti
Tanzania Day 3: Central to Western Serengeti
On this day, we did a game drive in central Serengeti in the morning and then headed to western Serengeti where we stayed at Mbalageti. Here are the animals we saw (new ones in bold): Baboons Spider-man agama Hartebeests ostriches zebras vervet monkeys impalas wildebeests giraffes warthogs hippopotamuses lions kori bustards Griffon vultures lovebirds marabou… Continue reading Tanzania Day 3: Central to Western Serengeti
Tanzania Day 2: Manyara to Serengeti
On Day 2, we drove from the escarpment above the Rift Valley to central Serengeti via Ngorongoro Conservation Area. The animals we saw (new ones in bold): Elephants ostriches zebras wildebeests heron antelopes Thomson’s gazelles Grant’s gazelles hyena serval lions kori bustard leopard griffon vultures Agama Hartebeest Starlings Weavers guinea fowl