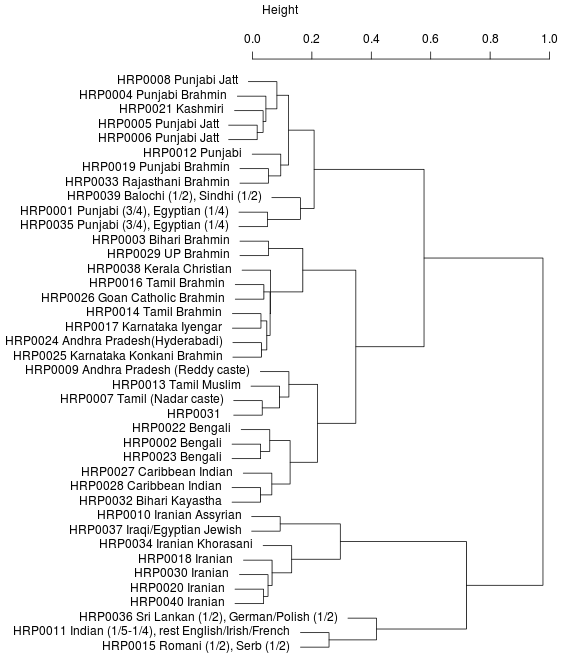
As I had computed the admixture percentages for myself, my sister and other participants in my Harappa Ancestry Project, I decided to do some clustering analysis on them to see which persons clustered together. The resulting tree for a hierarchical clustering is as follows. It shows which persons are the most similar.

I am HRP0001 and my sister is HRP0035. As expected, we cluster together and then with a half-Sindhi half-Balochi guy and finally with all the Punjabis.
Since I have a lot of reference populations in my data, I did the same cluster analysis using the average admixture results for each reference analysis. Here’s the section of the tree containing my sister and me.
This time we cluster with the Bene Israel, a Jewish tribe from Bombay, India, though our similarity with them is not that great. Then with the Punjabis, Sindhis and Pathan.
Doing the same analysis with individual samples from my references,

A weak clustering with Burusho!
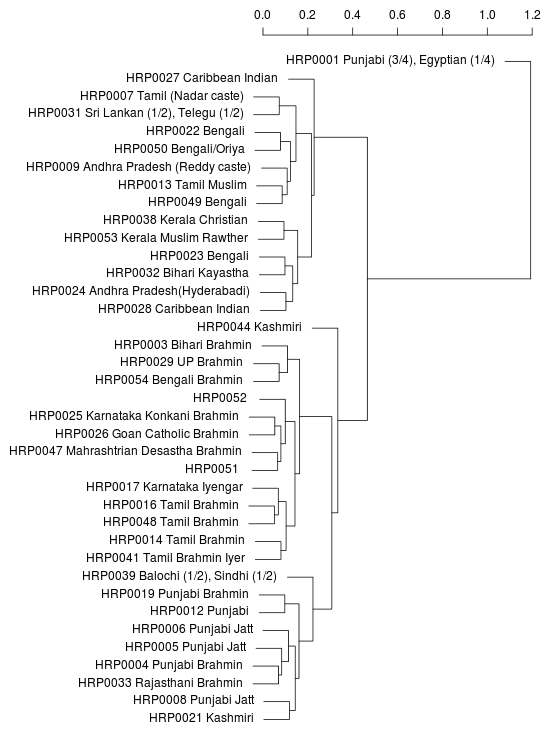
If I use PCA (Principal Component Analysis) results to compute hierarchical clusters, you can see that I am an outlier among the South Asian participants.

If you look at my PCA coordinates, you’ll realize that among the 365 South Asians I used in the analysis, I am one of the five complete outliers.
However, when I use model-based clustering on the PCA results, I end up in a really weird, loose cluster (CL9) with a Kashmiri, 5/21 Balochis, 2 Bene Israel Jews, 3/23 Brahui, 1/25 Burusho, 8/17 Makranis, 2/21 Pathans and 3/22 Sindhis. This is mostly a group of outliers and those who have some African admixture.
